 NK Mehta
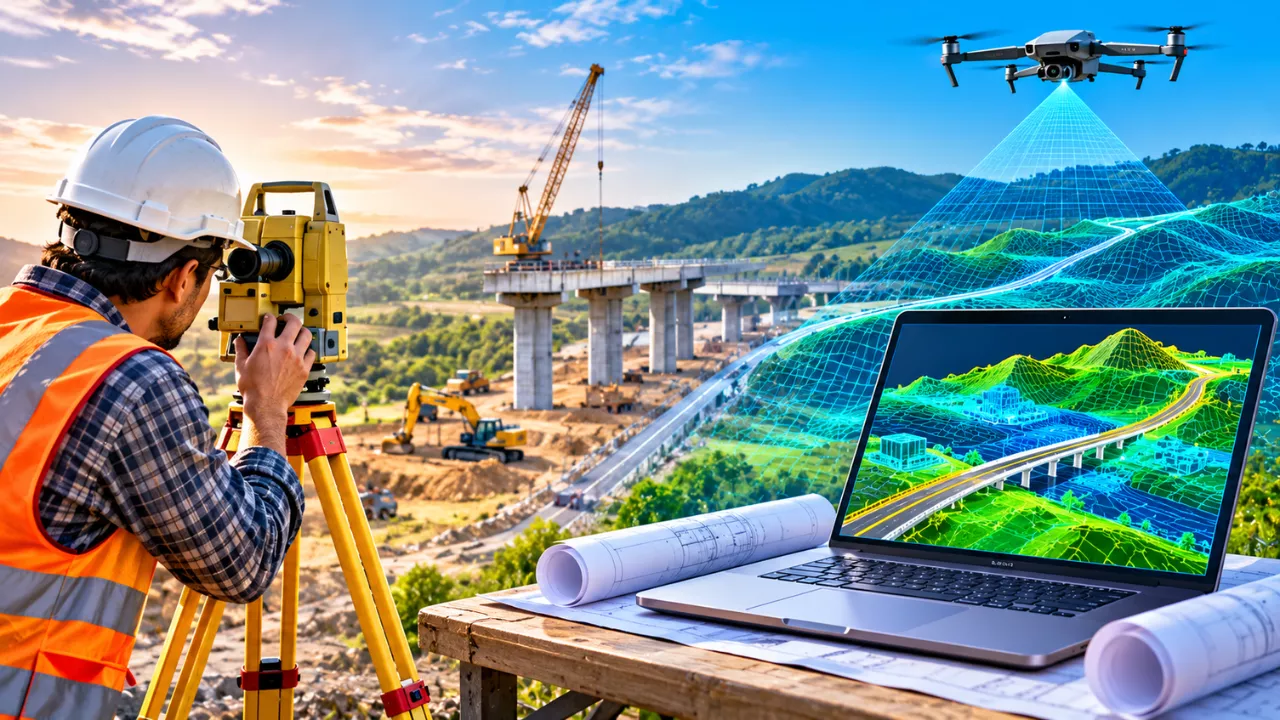
Every bridge, highway and metro line starts with a simple question: what does the ground actually look like? For more than a century, survey crews answered it with tripods, measuring chains and hand-drawn plans. Today, 3D digital mapping answers the same question faster, in far greater detail, and in a form that engineers, planners and the public can all understand.
This shift is not just about new gadgets. Instead, it changes how projects are designed, priced and approved. In this guide, we look at how surveying evolved, which tools power modern mapping, and what the change means for the roads and cities we will use tomorrow.
How Traditional Land Surveys Shaped Infrastructure
Traditional land surveying relied on careful, point-by-point measurement. A crew would set up a theodolite or, later, a total station over a known control point. They then measured angles and distances to other points, one shot at a time. Back in the office, draftsmen turned those readings into contour maps and cross-sections.
The method was remarkably accurate when done well. In fact, many property boundaries and national grids still rest on this work. However, it had clear limits:
- Slow fieldwork: Surveying a long road corridor could take weeks of walking and measuring.
- Sparse data: Crews captured only selected points, so details between them were often guessed.
- Safety risks: Surveyors had to work beside live traffic, on steep slopes or near rail lines.
- Flat outputs: Results came as 2D drawings, which non-engineers often found hard to read.
As projects grew larger and deadlines tighter, these gaps became costly. Consequently, design errors found late on site often led to redesigns, delays and budget overruns.
What Is 3D Digital Mapping?
3D digital mapping is the process of capturing the shape, position and features of land and structures as a measurable three-dimensional model. Rather than collecting a few hundred points, modern tools record millions. As a result, planners get a near-complete digital copy of a site before anyone breaks ground.
The Core Technologies Behind It
Several tools usually work together on a single project:
- LiDAR (Light Detection and Ranging): A laser scanner fires rapid pulses and times their return. Mounted on drones, aircraft, vehicles or tripods, it builds dense “point clouds” and can often see the ground through gaps in vegetation.
- Drone photogrammetry: Overlapping aerial photos are stitched by software into 3D surfaces and orthophotos. It is cost-effective for open sites such as quarries and new road alignments.
- GNSS positioning: Satellite receivers, especially with real-time correction, tie every scan and photo to accurate real-world coordinates.
- Mobile mapping systems: Vehicles fitted with scanners and cameras capture entire street corridors while moving with traffic.
- GIS and BIM platforms: These systems bring map data and building models together, so teams can design directly on top of real conditions.
Together, these tools turn raw measurements into models that are both accurate and easy to explore.
Traditional Surveys vs 3D Digital Mapping at a Glance
The table below compares the two approaches on the factors that matter most to project teams. Note that real-world figures vary with equipment, terrain and crew experience.
| Factor | Traditional land survey | 3D digital mapping |
|---|---|---|
| Main tools | Theodolite, total station, levels, tapes | LiDAR, drones, GNSS, mobile mapping |
| Data captured | Selected individual points | Millions of points plus imagery |
| Field time for large sites | Days to weeks | Hours to a few days |
| Output | 2D plans, contours, cross-sections | 3D models, point clouds, orthophotos |
| Worker exposure | High, often near traffic or hazards | Lower, much work done remotely |
| Ease of sharing | Limited to technical drawings | Viewable online by all stakeholders |
| Best suited for | Legal boundaries, small precise jobs | Corridors, cities, large or complex sites |
In practice, the two methods are not rivals. Licensed surveyors still set control points and verify results, while digital tools fill in the bigger picture.
How 3D Digital Mapping Is Transforming Infrastructure Planning
The biggest benefit of 3D digital mapping is that problems appear on screen rather than on site. When designers can see every slope, drain and utility pole in context, they make better decisions early, when changes are still cheap.
Smarter Route and Site Selection
For a new highway or rail line, planners can compare several alignments using the same detailed terrain model. Moreover, they can calculate earthwork volumes, spot flood-prone low ground and check sightlines before committing to a route.
Fewer Clashes and Redesigns
Underground pipes, overhead cables and existing foundations often cause costly surprises. By combining scan data with utility records in a BIM environment, teams can detect clashes in advance. Similarly, contractors can plan excavation more confidently.
Clearer Communication With the Public
A realistic 3D view is easier to understand than a technical drawing. Therefore, councils and agencies increasingly use mapped models in public consultations, helping residents see how a flyover or metro station will actually fit their street.
Better Monitoring During Construction
Repeat scans let engineers compare progress against the design. They can also track settlement, slope movement or deformation over time, which supports safer and more transparent project delivery.
The Challenges Planners Still Face
Despite its strengths, 3D mapping is not a magic fix. A few practical hurdles still slow adoption, especially for smaller firms and local authorities:
- Upfront cost: Survey-grade LiDAR units and processing software require serious investment.
- Huge data volumes: A single corridor scan can produce many gigabytes, so storage and processing need planning.
- Skills gap: Teams need trained people who understand both surveying principles and the software.
- Regulation: Drone flights often need permits, and airspace rules differ from country to country.
- Quality control: A beautiful model is not always an accurate one. Without proper ground control and checks, errors can hide inside the data.
For these reasons, experienced surveyors remain essential. Their judgement is what turns a dense point cloud into data that engineers can trust.
What Comes Next: Digital Twins and AI-Driven Mapping
The next step goes beyond a one-time map. A digital twin is a living 3D model of a road, bridge or city that updates with fresh scans and sensor readings. Consequently, owners can plan maintenance before a fault becomes a failure.
Artificial intelligence is also speeding up the work. Software can now help classify point clouds, picking out kerbs, poles, trees and road markings that once took hours to trace by hand. Meanwhile, cheaper sensors and cloud platforms are making these tools accessible to mid-sized firms, not just large agencies.
Ultimately, the move from tripods to 3D models is about confidence. When planners understand the ground in full detail, they can build infrastructure that is safer, better value and easier for communities to accept.
Frequently Asked Questions
Is 3D digital mapping more accurate than a traditional survey?
It can be, but accuracy depends on the equipment and ground control used. A total station is still extremely precise for individual points, while 3D mapping captures far more detail across a whole site.
Will 3D mapping replace land surveyors?
No. It changes their tools, not their role. Qualified surveyors still establish control, check data quality and handle legal boundary work.
What is the difference between LiDAR and photogrammetry?
LiDAR measures distance with laser pulses and can often reach the ground beneath vegetation. Photogrammetry builds 3D surfaces from overlapping photos and usually works best on open, well-lit sites.
What is a digital twin in infrastructure?
A digital twin is a continuously updated 3D model of a real asset. Owners use it to monitor condition, plan repairs and test changes before making them on site.